Gallery
Line plots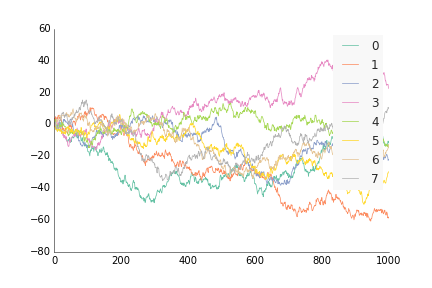
|
Line plots with modified legend
|
Scatterplot
|
Back to matplotlib defaults...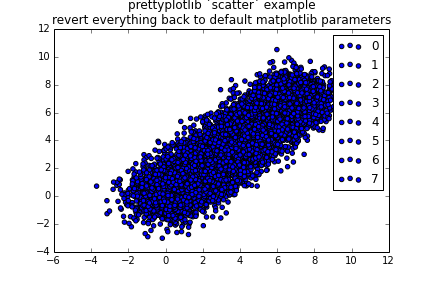
|
Bar plot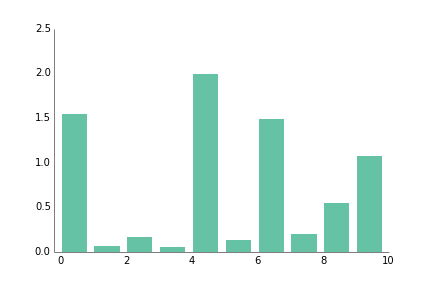
|
Bar plot with white grid
|
Bar plot with annotation
|
Bar plot with arbitrary annotation
|
Annotated bar plot with negative values
|
Bar plot with labels
|
If you have a large number of values and you're curious about the distribution of values within the data, hist is the function for you!
Histogram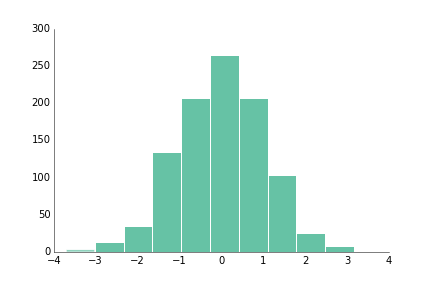
|
Histogram with a white grid
|
If you have several categories, and each category has a distribution you'd like to compare to others, boxplot may be a nice way to visualize these distributions and their differences.
Box plot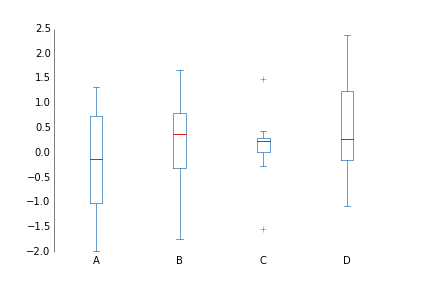
|
If you have a 2d matrix and you'd like to visualize which values are larger or smaller than others, a heatmap via pcolormesh may be nice.
Heatmap with both positive and negative values
|
Heatmap with only positive values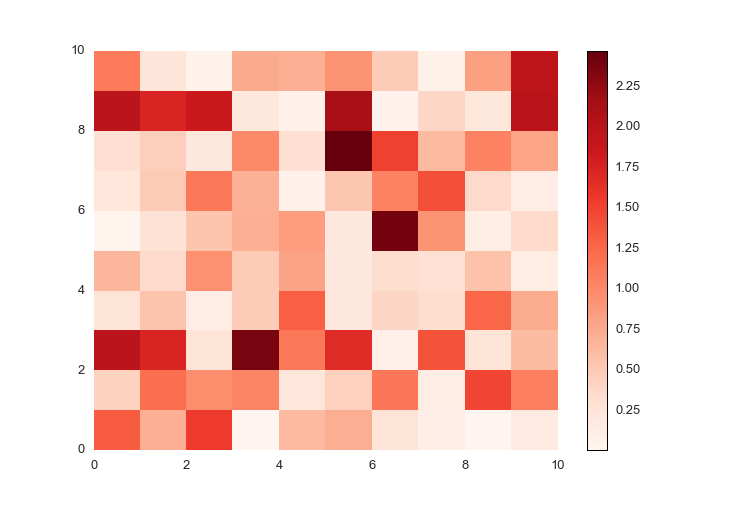
|
Heatmap with only negative values
|
Heatmap with x- and y-labels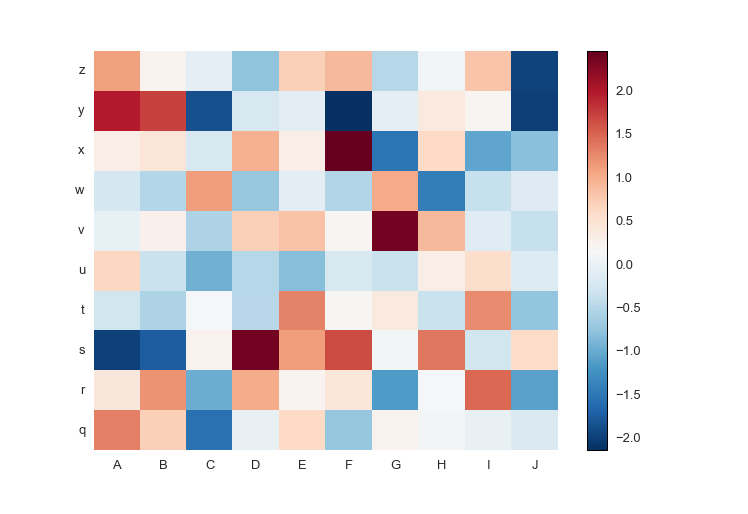
|
Heatmap with custom colormap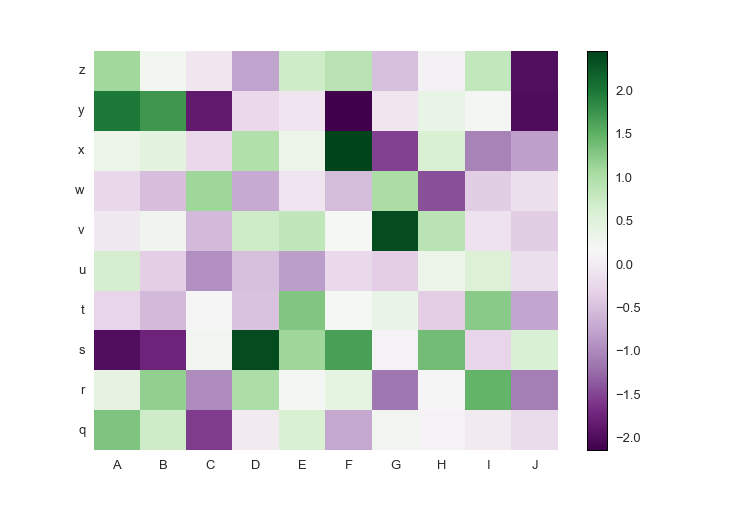
|
Positive-only heatmap with custom colormap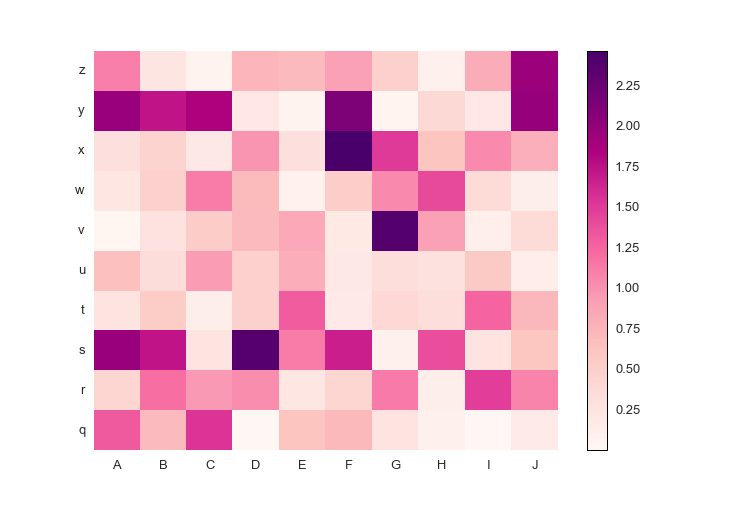
|
Log-scaled heatmap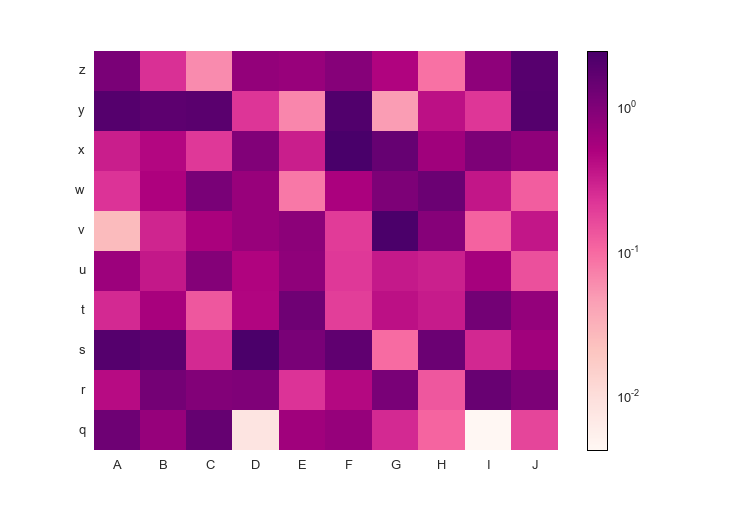
|