Implement a function to calculate inverter model parameters #975
Comments
|
Progress report: I've spent some time on the datasheet function and it's not looking great. There's a technique to get to Sandia inverter model parameters from measured efficiency, following the CEC test protocol. I've coded this technique. It uses several regressions that assume replicated measurements of efficiency. Datasheets for inverters typically provide efficiency at a sequence of output AC power points, at different DC voltage input levels. Feeding these data into the parameter method for measured data (adjusted for the lack of replicated measurements) yields parameter values which, when put into the inverter model, don't precisely reproduce the input efficiencies. I think this is a problem. I've tried various techniques to get to parameters from some test efficiency curves that are calculated from assumed parameters, and can't (yet) reliably recover the known parameters. An alternate idea: implement a new inverter efficiency model that basically interpolates on the values found in a datasheet. The interpolation needs to be a bit more sophisticated than simply linear between input power levels, to preserve the downward curving shape of the input DC power vs. efficiency curve. I'm thinking that the convexity-preserving quadratic spline Looking for feedback on the value of and interest in a datasheet-based inverter efficiency model. |
|
@cwhanse Thanks for the update and for the pointers. I have read Sandia's Performance Model for Grid-Connected Photovoltaic Inverters and that helped me understand the model. 😊
I agree this should be the first step in order to validate the code implementation. Have you uploaded your code somewhere? If so, I would love to have a look at it.
What do you mean by "adjusted"? I am guessing with the datasheet points you just have fewer data to fit the parameters. Or do you adjust/transform them somehow?
This could be complementary to the first idea. I think a function to calculate CEC parameters could still be useful. At least for the "minimum" model: just calculating the quadratic function to account for the curvature ( I was surprised when I found the
Or am I misunderstanding something? |

|
By the way, the efficiency curve I just posted above (SMA's Sunny Tripower 6.0) looks like a buck-boost converter efficiency curve. For example, this is the curve of the LM5175 buck-boost converter:
Where the highest efficiency is achieved at the closest-to-output V_in. Higher V_in means lower efficiency, and lower V_in means lower efficiency too. Does it mean that some inverters have a DC-DC converter stage and then a DC-AC converter stage? That could make sense for a multi-MPPT inverter. In example, for a 2-MPPTs inverter:
In which maybe the DC-AC stage operates at a constant V_in and this setup allows for each of the MPPT to operate at a different V_in. Do you know if that could be the case for a multi-MPPT inverter? Is it always the case that there are 2 separate stages and the DC-AC stage operates at constant V_in? (i.e.: there is always a DC-DC converter, even for single-MPPT inverters) I am trying to understand how an inverter works internally, but maybe there is a better place to ask/discuss this? 😇 |


|
@cwhanse Friendly ping with respect to:
If you would rather not share it, I may code it myself, but I would rather not duplicate work. 😇 |
|
@Peque sorry got busy with other things. WIP is at https://github.com/cwhanse/pvlib-python/tree/inverter_fit . |
|
@Peque I found and fixed an issue with my calculation of inverter efficiency curves, for testing the datasheet fitting function. The algorithm now recovers the known parameters with reasonable accuracy, and the efficiency calculated from the recovered parameters agrees well with the input efficiency. Please take a look. As soon as we merge #886 I'll submit another PR to add the inverter fitting functions. |
|
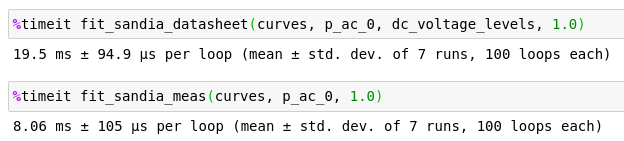
@cwhanse Thanks a lot for sharing! 😊 I had to wait until the weekend to find some time to have a look at it... 😅 I see you have 2 separate implementations. Both implementations, however, look similar, and they are both used to calculate the same Sandia parameters. I wonder if a single function could/should be used, instead of two. See for example: from pvlib.inverter_fits import fit_sandia_datasheet
from pvlib.inverter_fits import fit_sandia_meas
dc_voltage_levels = {'Vmin': 220., 'Vnom': 240., 'Vmax': 260.}
p_ac_0 = 1000.
curves = read_csv("pvlib/data/inverter_fit_snl_datasheet.csv")
curves["dc_voltage"] = curves["dc_voltage_level"].apply(lambda level: dc_voltage_levels[level])
curves["ac_power"] = curves["pac"]
datasheet_params = fit_sandia_datasheet(curves, p_ac_0, dc_voltage_levels, 1.0)
meas_params = fit_sandia_meas(curves, p_ac_0, 1.0)Now, this is what {'Paco': 1000.0,
'Pdco': 1050.0,
'Vdco': 240.0,
'Pso': 10.000304429963938,
'C0': 9.9883399204206e-07,
'C1': 9.999994488189908e-05,
'C2': 0.009999747784568034,
'C3': 0.0010013954894991116,
'Pnt': 1.0}And the {'Paco': 1000.0,
'Pdco': 1050.0000008984525,
'Vdco': 240.0,
'Pso': 9.999999860749542,
'C0': 9.999994978389884e-07,
'C1': 9.999996161482867e-05,
'C2': 0.009999996315292192,
'C3': 0.0010002283566649965,
'Pnt': 1.0}It seems like the
So maybe keeping just the I have not carefully read through the implementation of each function, and will wait to hear from you before doing so (in case I can skip one of the implementations 😇 ). Anyway they look great so far! 😊 |
|
Thanks for verifying that both functions return equivalent parameters. The mistake I had made in calculating the efficiency curves from assumed parameters was the initial reason for looking for a _datasheet method, since the _meas method wasn't returning good values (due to the error in the input curves). I'm thinking along the same lines as you suggest: that these two functions aren't really that different and could be combined. I'll look into that. |
|
I think the _meas() method may be more complicated than is necessary, in that it gets C0-C2 from regressions on coefficients from an earlier regression. I'd like to explore if that part can be made more transparent. |
|
The advantage of the Once you decide on the best method to keep, I will have a look at it more in detail. Thanks! |
From measured efficiency curves and datasheets.
See the previous discussion for more context.
The text was updated successfully, but these errors were encountered: